
range and distribution in
Britain and Ireland
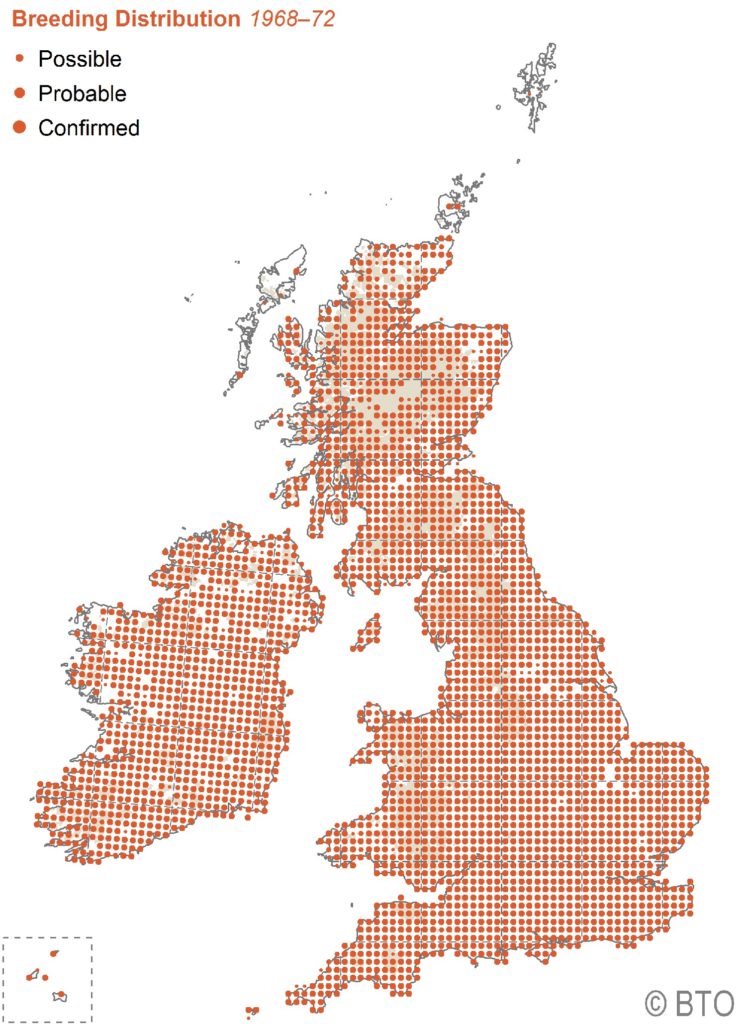
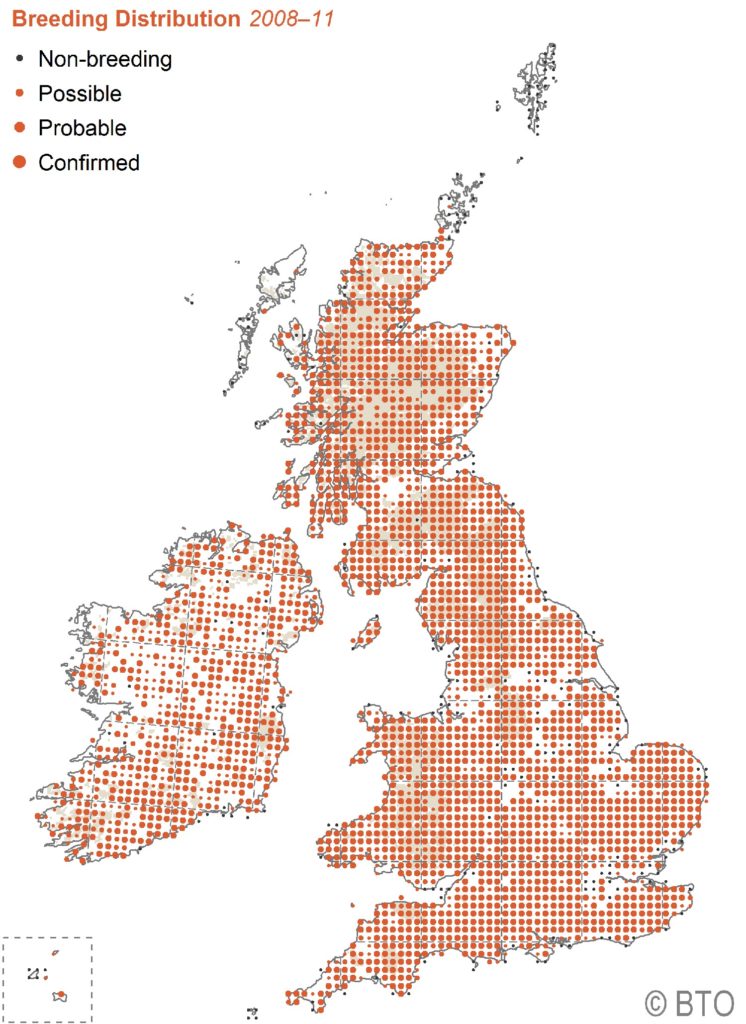
The BTO has completed three Atlas projects, each the result of four years’ fieldwork: 1968–72, 1988–91 and 2008–11. These Atlases have been mapped against 10km squares based on the OS National Grid.
the new Atlas
The 2008–11 Atlas shows that Spotted Flycatchers remain a widespread species in Britain and Ireland. In fact, flycatchers can be found almost everywhere except the Outer Hebrides, Shetland, Orkney and the denser urban centres. Birds were present in 75% of squares in Britain and Ireland, and breeding was confirmed in 54% of them (the large red dots below) .

In the first atlas 1968-72, 86% of squares held flycatchers, and 90% of these had confirmed breeding pairs.
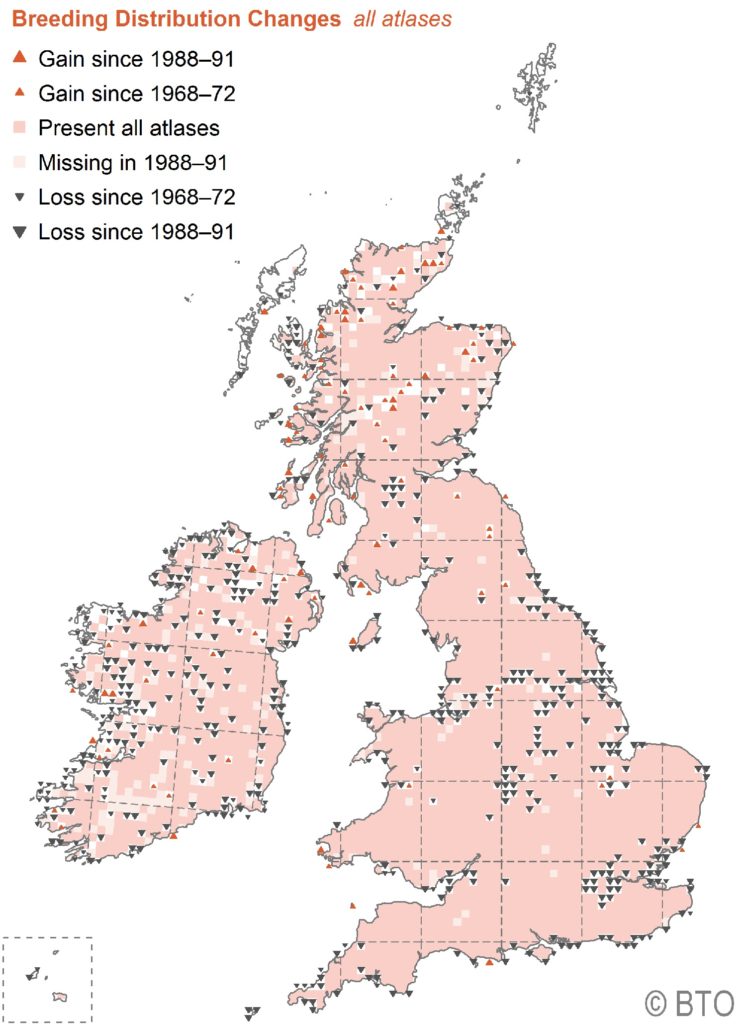
Here are the two maps together

Overall range losses in Britain have thus been relatively minor. They amount to only 10% (at the 10km square resolution) over the forty years. In Ireland, however, there has been a more substantial range contraction, with the species now absent from many squares along the west coast where it has always been patchily distributed.
changes in abundance
The decline has been a function of reduced abundance/density rather than of distribution range. Spotted Flycatchers are one of the most declined species in Britain and Ireland. The species is now UK Red-listed as a bird of increasing conservation concern. The important point to note is that it takes just a single breeding pair to register the species as ‘present’ within a 10km square (= 100 square kilometres). Densities on census plots in the 1960s ranged from ten or more pairs per square km in good areas to a general figure of about one pair per square km on lowland farms with only scattered trees. Such densities are a distant memory today; there may even be some 10km squares with just one breeding record in the new Atlas.
Decreases in overall abundance have amounted to 88% since 1970. This is particularly noticeable within Cambridgeshire (as throughout Britain and Ireland) when considered at the more granular tetrad (2km square level). The distribution map below simply shows the changes in presence vs absence in each 10km square over the forty years.
[The text and maps above are derived from the BTO’s
Bird Atlas 2007-11
The breeding and wintering birds of Britain and Ireland
(Dawn Balmer et al. 2013).]