
breeding abundance in
Britain and Ireland
The BTO has completed three Atlas projects, each the result of four years’ fieldwork: 1968–72, 1988–91 and 2008–11. These Atlases have been mapped against 10km squares based on the OS National Grid.
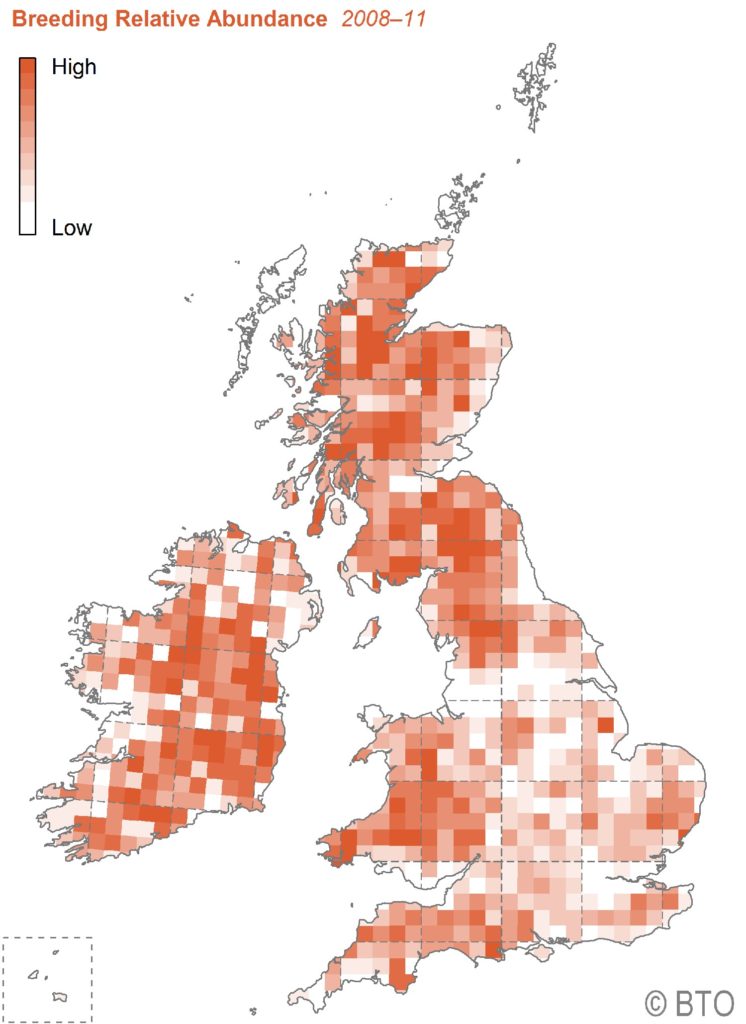
relative abundance over time
Relative abundance measures were only recorded for the two latest Atlases; this allows comparison after a twenty year interval. The 2008-11 Atlas shows that current densities are generally highest in the north and west – excluding the highest upland areas – and lowest in the east and south-east of England and along the western coast of Ireland.
The relative abundance change map (2008-11 against 1988-91 as below) shows declines, some very marked, throughout England and lowland Scotland, with maybe just a suggestion that the species may be faring better in north-west Scotland and southern Ireland.
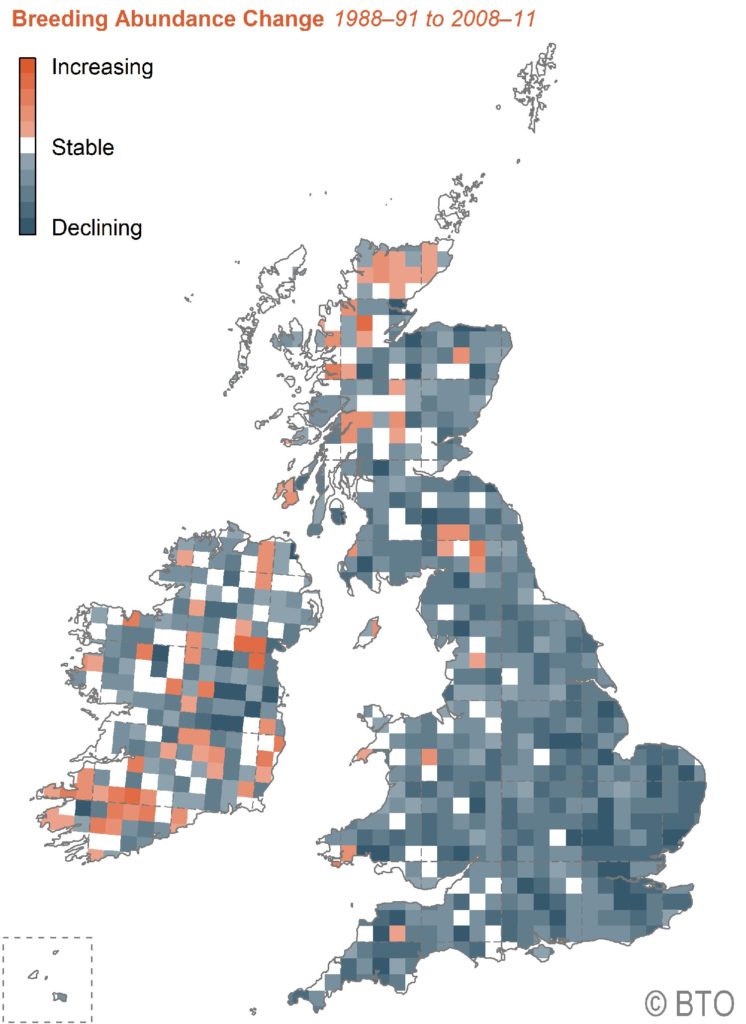
This trend, if it is one, is shared with other long-distant migrants such as Willow Warbler, House Martin and Cuckoo and may be associated with changes in climate, mixed vs arable farming and/or differential rates of decline in invertebrate densities. It may also be related to migration strategies by sub-populations: differential timing, routes, stopovers and/or wintering areas.
As a result of these declines, the species is now Red-listed as a bird of increasing conservation concern. Similar, if more moderate, declines have been recorded across the rest of Europe.
[The text and maps above are derived from the BTO’s
Bird Atlas 2007-11
The breeding and wintering birds of Britain and Ireland
(Dawn Balmer et al. 2013).]